Executive Dashboard Software: What CEOs and CFOs Actually Need in 2026
Your finance team spends days building a board pack. By the time the CEO reads it, the numbers are stale. Meanwhile, the CFO is fielding ad-hoc data requests that pull analysts away from real work.
This is the executive reporting problem — and it is not a people problem. It is an infrastructure problem. The data exists across your ERP, CRM, accounting software, and bank feeds. What is missing is a single layer that consolidates it, keeps it current, and presents it in a format that helps leadership act.
That layer is executive dashboard software. This guide covers what it should do, what features matter for CEOs and CFOs specifically, and how to evaluate platforms without getting lost in enterprise-grade complexity your company does not need.
Key Takeaways
- Real-time or near-real-time data. Not last week’s numbers. Today’s
- The vendor demo uses sample data instead of connecting to your actual systems
- Dashboard setup requires SQL, DAX, or a technical consultant
- There is no mobile experience, or the mobile version is a stripped-down afterthought
- The platform cannot show live data in the first demo — only static screenshots
What Is Executive Dashboard Software?
Executive dashboard software is a category of business intelligence tools designed specifically for C-suite decision-makers. Unlike general BI platforms that serve data analysts, executive dashboards prioritise clarity, speed, and relevance over analytical depth.
The distinction matters:
- General BI tools (Tableau, Power BI, Looker) are analyst-first. They offer deep customisation, complex data modelling, and visualisation flexibility — but require technical skills to configure and maintain.
- Executive dashboard software is leader-first. It arrives with pre-built views for the metrics CEOs and CFOs care about, connects to existing systems through API connectors, and surfaces insights without requiring anyone to write queries or build data models.
The best executive dashboard platforms in 2026 go further: they include AI-driven anomaly detection, conversational query interfaces, and predictive forecasting — capabilities that turn a static reporting layer into an active decision-support system.
Why the CEO Dashboard Has Become a Strategic Priority
Executive dashboards are not new. What changed is the expectation around them.
Five years ago, a monthly PDF report emailed to the CEO was acceptable. In 2026, leadership teams expect:
- Real-time or near-real-time data. Not last week’s numbers. Today’s.
- Self-service access. The CEO should not need to email the finance team every time they want a number. They should be able to look it up — or ask the system directly.
- Exception-first reporting. Instead of scrolling through pages of data looking for problems, the dashboard should surface anomalies automatically. What spiked? What dropped? What is trending in the wrong direction?
- Mobile access. Decisions do not wait for office hours. CEOs review data from airports, hotels, and during commutes. If the dashboard requires a VPN or desktop app, it fails this test.
For Malaysian companies operating under tightening regulatory requirements — Bursa Malaysia ESG reporting, IFRS S2, CBAM for exporters — the CEO dashboard is also becoming the surface through which leadership monitors compliance readiness alongside financial performance.
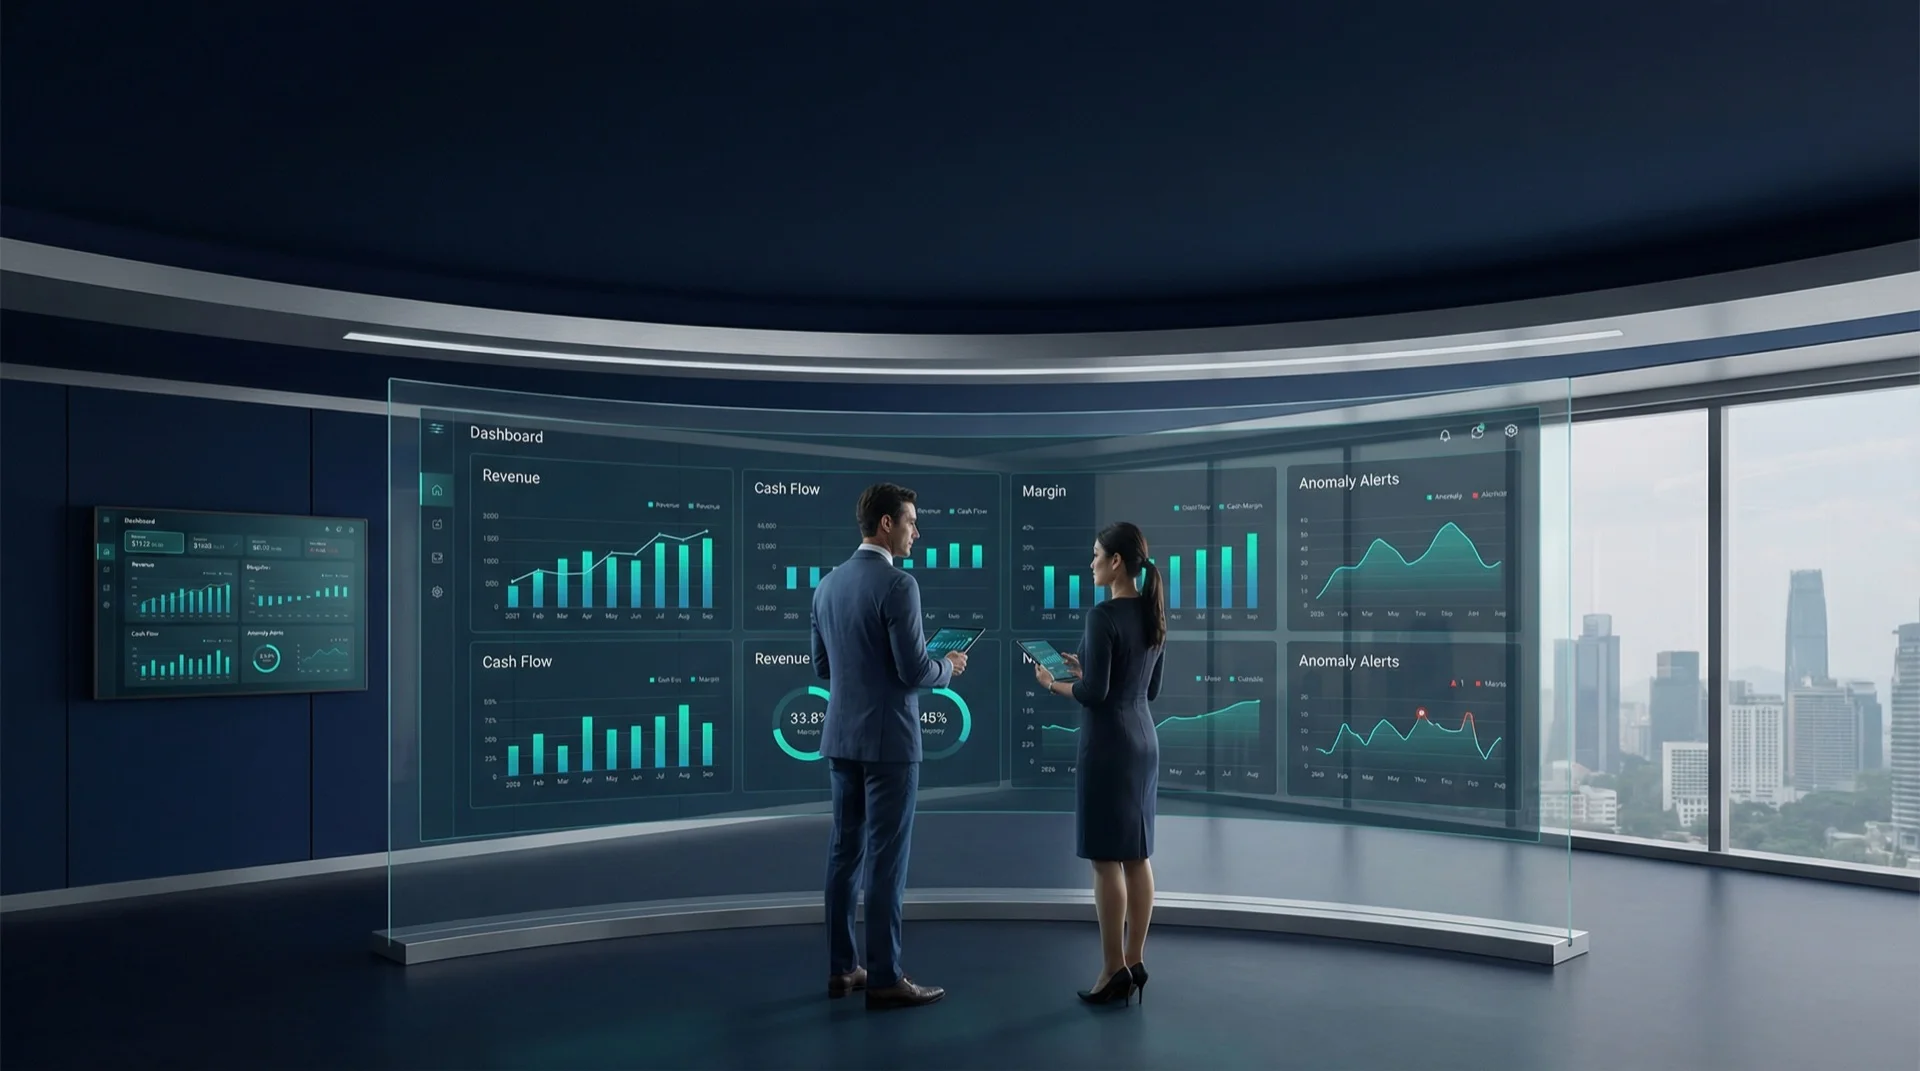
What a CEO Dashboard Should Actually Show
The most common mistake in executive dashboard design is including too much. A CEO does not need 47 metrics. They need five to eight KPIs that answer the questions they ask every week, plus an exception layer that flags anything unusual.
The CEO Weekly Overview
| Metric | What It Answers |
|---|---|
| Revenue (actual vs target) | Are we on track this period? |
| Cash position + 30-day forecast | Do we have runway? Any near-term pressure? |
| Gross margin by segment | Which parts of the business are most profitable right now? |
| AR aging summary | Are customers paying on time? Is cash collection slowing? |
| Top 5 anomalies (AI-flagged) | What changed unexpectedly this week? |
| Operational KPI (fulfilment, NPS, or production rate) | Is the engine running or sputtering? |
This is the “Monday morning” view. A CEO opens it, spends five minutes scanning, and knows whether to dig deeper or move on. If the answer to every question is “on track,” the dashboard should be short. A busy dashboard means either something is wrong or the dashboard is poorly designed.
The CFO Financial Health Dashboard
| Metric | What It Answers |
|---|---|
| P&L summary (MTD + YTD) | Where are we against the plan? |
| OpEx breakdown with budget variance | Which cost centres are over budget and by how much? |
| Cash flow waterfall | What came in, what went out, and what is committed? |
| Working capital position | Are we liquid enough for the next 90 days? |
| Debt service and upcoming commitments | What fixed payments are coming due? |
| ESG compliance status | Are we on track for sustainability reporting deadlines? |
The CFO dashboard goes deeper than the CEO view. It is the control panel for financial operations — the place where margin erosion, cost overruns, and cash flow risks surface before they become crises.
The Operations Performance Dashboard
| Metric | What It Answers |
|---|---|
| Order fulfilment rate | Are we delivering on time? |
| Average delivery time (trend) | Is logistics getting faster or slower? |
| Inventory levels + reorder alerts | Are we at risk of stockouts or overstocking? |
| Supplier performance scorecard | Which suppliers are underperforming? |
| Production throughput | Is the factory running at target capacity? |
Build vs Buy: Three Approaches to Executive Dashboards
Companies typically choose one of three paths. Each has trade-offs.
Approach 1: Build It Yourself With a General BI Tool
Platforms: Tableau, Power BI, Looker, Metabase
How it works: Your team (or a consultant) connects data sources, builds a data model, designs dashboards, and maintains the infrastructure.
Pros: Maximum flexibility. You can model anything. Deep analytical capabilities for power users.
Cons: Requires technical skills (DAX, SQL, data modelling). Setup takes months. Ongoing maintenance needs a dedicated person or consultant. Dashboards break when source systems change. Most SMEs underestimate the total cost of ownership.
Best for: Companies with an in-house data analyst or BI team who need highly customised analytical environments.
Approach 2: Use Your Accounting Software’s Built-In Reports
Platforms: Xero dashboards, QuickBooks reports, Zoho Analytics
How it works: Your accounting or ERP platform includes basic reporting and dashboard features.
Pros: No additional cost. Data is already there. Quick to access.
Cons: Limited to data within that single system. Cannot consolidate data from CRM, operations, HR, or bank feeds. No cross-system insights. No anomaly detection or AI capabilities. Fine for bookkeeping-level reporting; insufficient for executive decision-making.
Best for: Very early-stage companies with one primary data source and basic reporting needs.
Approach 3: AI-Native Executive Dashboard Platform
Platforms: Lestar.ai CEO360, and emerging platforms in this category
How it works: The platform connects to your ERP, CRM, accounting software, and bank feeds via pre-built API connectors. Data is pulled into a centralised cloud repository automatically. AI processes the data to detect anomalies, generate forecasts, and enable natural language queries. Pre-built executive views are ready on deployment.
Pros: Fast deployment (days to weeks, not months). No technical skills required. AI capabilities included — anomaly detection, conversational queries, predictive forecasting. Pre-built CEO and CFO dashboard views. Cloud-based with mobile access.
Cons: Less customisable than building from scratch with Tableau or Power BI. Best suited for companies that want answers, not an analytics sandbox.
Best for: SMEs and mid-market companies where leadership needs a decision-support layer without building a data team.
The Conversational Dashboard: Why It Changes Everything
The single most impactful feature in modern executive dashboard software is the conversational AI interface. Here is why.
Traditional dashboards are passive. They show you what was configured. If the answer to your question is not on the dashboard, you email the finance team and wait.
A conversational interface is active. The CEO types: “What was our logistics spend in the Northern Region Q3 vs Q2?” The system queries the centralised data repository, generates a comparison, and returns the answer in seconds. No intermediary. No waiting.
This matters because the questions executives ask are unpredictable. No dashboard designer can anticipate every query a CEO will have during a board meeting, a strategy session, or a 6 AM flight review. The conversational layer makes the entire dataset accessible through plain language, not just the pre-configured views.
Lestar CEO360 implements this through a read-only AI query engine. The AI executes SELECT queries against your centralised data — it cannot modify, delete, or alter anything. The CEO gets answers; the data stays protected.
How to Evaluate Executive Dashboard Software
Use this framework when comparing platforms:
| Criteria | What to Verify | Why It Matters |
|---|---|---|
| Data source coverage | Pre-built connectors for your ERP, CRM, accounting software, bank feeds | If it cannot connect to your systems out of the box, deployment will take months |
| Time to first dashboard | Days to weeks, not months | Long implementations kill adoption — leadership loses interest |
| Pre-built executive views | CEO and CFO dashboards ready on deployment | Avoids the “blank canvas” problem where nothing is configured for months |
| AI capabilities | Anomaly detection, conversational queries, predictive forecasting | Turns a reporting tool into a decision-support system |
| Mobile access | Full functionality via browser on phone and tablet | CEOs review data outside the office — the platform must work everywhere |
| Role-based access | Granular permissions so each user sees only relevant data | CFO sees financials; sales lead sees pipeline; data stays controlled |
| Security posture | ISO 27001 certification, data encryption, regional hosting options | Financial data centralisation requires enterprise-grade security |
| ESG and compliance integration | Can surface sustainability metrics alongside financial KPIs | IFRS S2 requires financial and ESG data in the same reporting surface |
Red Flags When Evaluating
- The vendor demo uses sample data instead of connecting to your actual systems.
- Dashboard setup requires SQL, DAX, or a technical consultant.
- There is no mobile experience, or the mobile version is a stripped-down afterthought.
- The platform cannot show live data in the first demo — only static screenshots.
- Pricing scales by number of data sources or connectors. This penalises growing companies.
- No mention of data security certifications when you ask.
The Bottom Line
Executive dashboard software in 2026 is not about prettier charts. It is about giving CEOs and CFOs a reliable, real-time window into business performance — one that updates automatically, flags problems before they escalate, and answers questions on demand.
The companies that operate with this level of visibility make faster decisions, catch issues earlier, and spend less time waiting for reports that arrive too late to act on. The companies that do not are still emailing spreadsheets on Thursday and hoping the numbers are right by Monday.
If your leadership team is ready to move beyond static reports and ad-hoc data requests, Lestar.ai CEO360 is built for exactly this — executive dashboard software that connects to your existing systems, surfaces AI-driven insights, and lets your CEO ask questions in plain English. Request a demo to see it with your own data.
Ready to give your leadership team real-time visibility? Talk to the Lestar CEO360 team today.
More ESG Insights
ESG Reporting Standards 2026: A Complete Guide for Malaysian Organizations
Navigate the evolving landscape of ESG reporting standards — GRI, TCFD, SASB, Bursa, and CSRD — and understand what your organization needs to report in 2026.
Bursa ESG Reporting Solution: A Step-by-Step Guide for PLCs
ESG reporting is now mandatory for Malaysian public-listed companies. This step-by-step guide covers the Bursa Malaysia framework, reporting requirements, key challenges, and how purpose-built ESG software helps PLCs stay compliant.
Artificial Intelligence Services for Better Business Decision-Making
AI services are transforming how businesses make decisions — from data analysis and predictive analytics to automation and real-time processing. Discover how AIaaS can give your organisation a competitive edge.
Ready to Centralise Your Enterprise Data?
Whether you need Lestar ESG for sustainability reporting, Lestar CEO360 for executive intelligence, or a fully customised enterprise data implementation — Mandrill Tech will tailor the solution to your organisation's needs.